import numpy as np
from datetime import datetime
import matplotlib.pyplot as plt
from echaim import density_path
# Defining date of observation
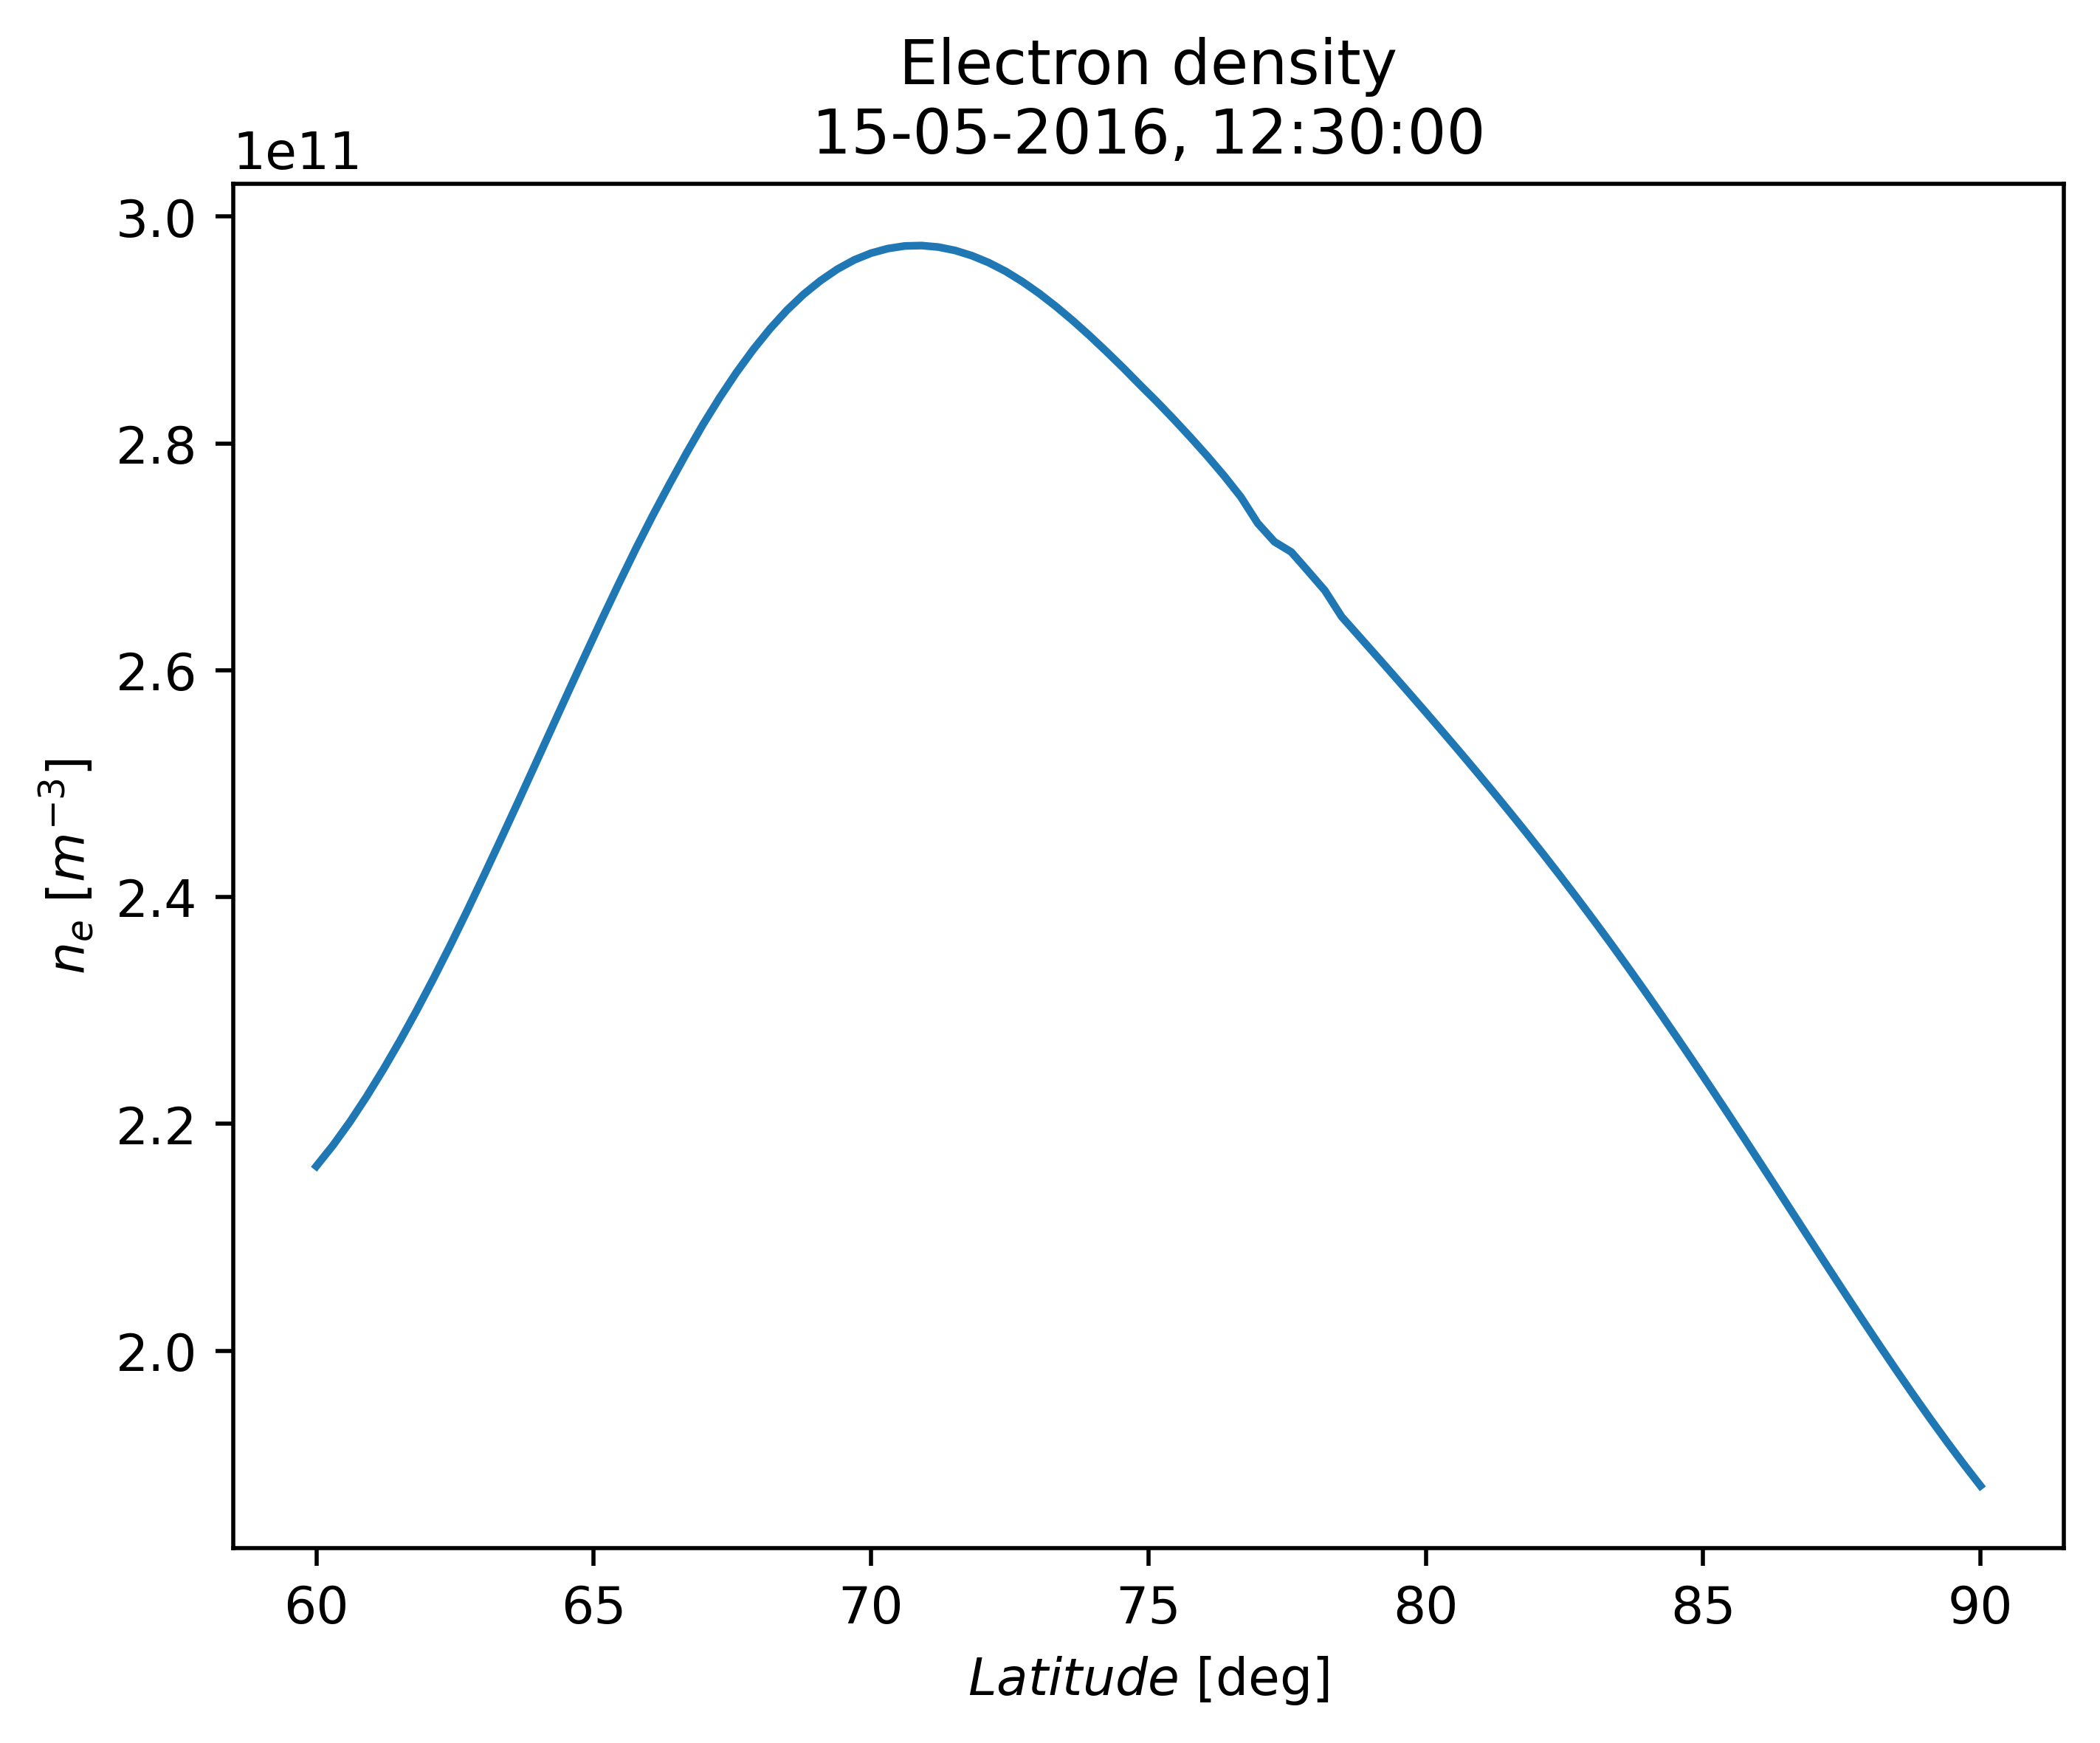
dt = datetime(year=2016, month=5, day=15, hour=12, minute=30)
# Defining coordinate of observation
ncoords = 100
lats = np.linspace(60, 90, ncoords)
# Using constant longitude (not necessarily)
lons = np.zeros(ncoords) - 75
# Using constant altitude (not necessarily)
alts = np.zeros(ncoords) + 250
dens_path = density_path(lats, lons, alts, dt, True, True, True)
plt.plot(lats, dens_path)
plt.title("Electron density\n" + dt.strftime("%d-%m-%Y, %H:%M:%S"))
plt.ylabel(r"$n_e$ [$m^{-3}$]")
plt.xlabel(r"$Latitude$ [deg]")
plt.show()