import numpy as np
from datetime import datetime
import matplotlib.pyplot as plt
from echaim import density_profile
# Defining date of observation
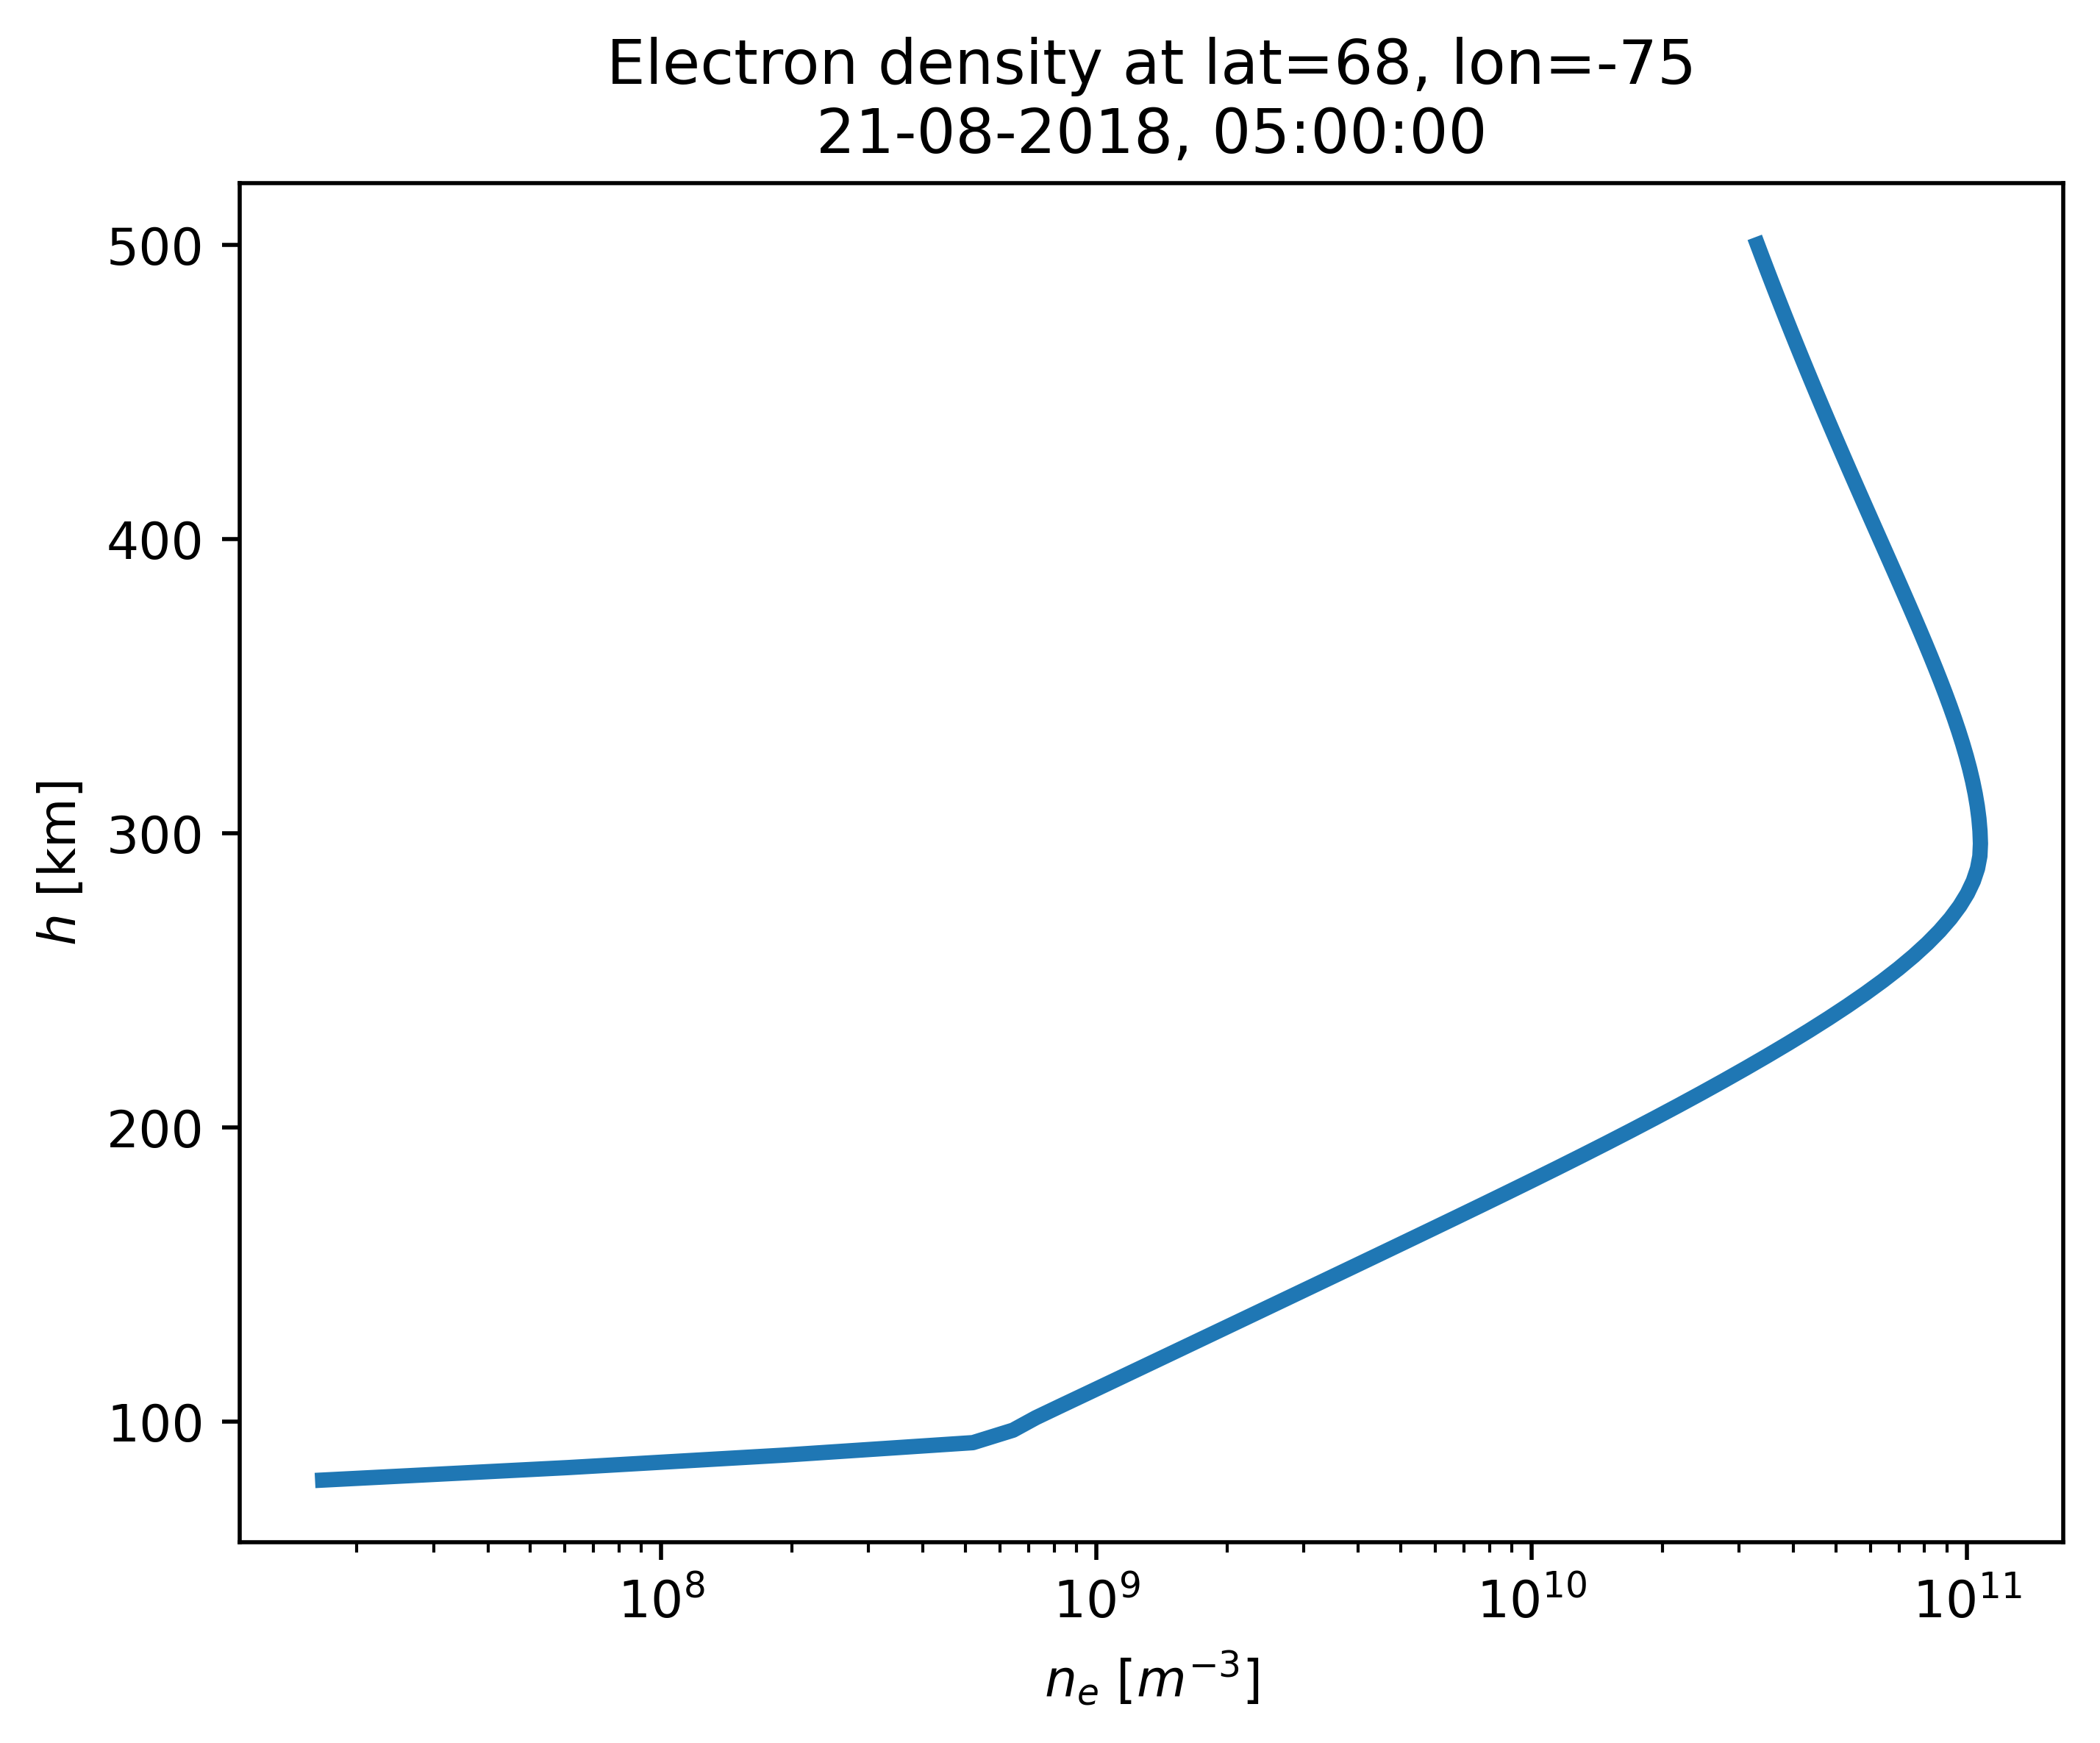
dt = datetime(year=2018, month=8, day=21, hour=5)
# Defining coordinate of observation - echaim.density_profile accepts
# only np.ndarray as input for coordinates
lats = np.array([68])
lons = np.array([-75])
alts = np.linspace(80, 500, 100)
# Using [0] index because density_profile returns 2D array,
# and we use only single coordinate point
altprof = density_profile(lats, lons, alts, dt, storm=True, precip=True, dregion=True)[0]
plt.semilogx(altprof, alts, lw=3)
plt.title(f"Electron density at lat={lats[0]}, lon={lons[0]}\n" +
dt.strftime("%d-%m-%Y, %H:%M:%S"))
plt.xlabel(r"$n_e$ [$m^{-3}$]")
plt.ylabel(r"$h$ [km]")
plt.show()